PRODUCTION MANAGEMENT
TransGraph > Moduls > Production management

More transparency within production...
How does TransGraph improve
the production processes?
- Permanent transparencyof all production data
- List of all associated samples (traffic lights)
- Permanent article-related minimum inventory control by e-mail including range determination
- Automatic, manual recording of posting sets
- Control/Releasebased on the four-eyes principle
- Variety-specific management of inventories (materials management) and recipes
- Assignment of documentsfrom document management, e.g. work instructions
- Data transfer to a BI-software (big data), e.g. Power-BI from Microsoft
- Costs are saved and risksare minimized, added value is increased
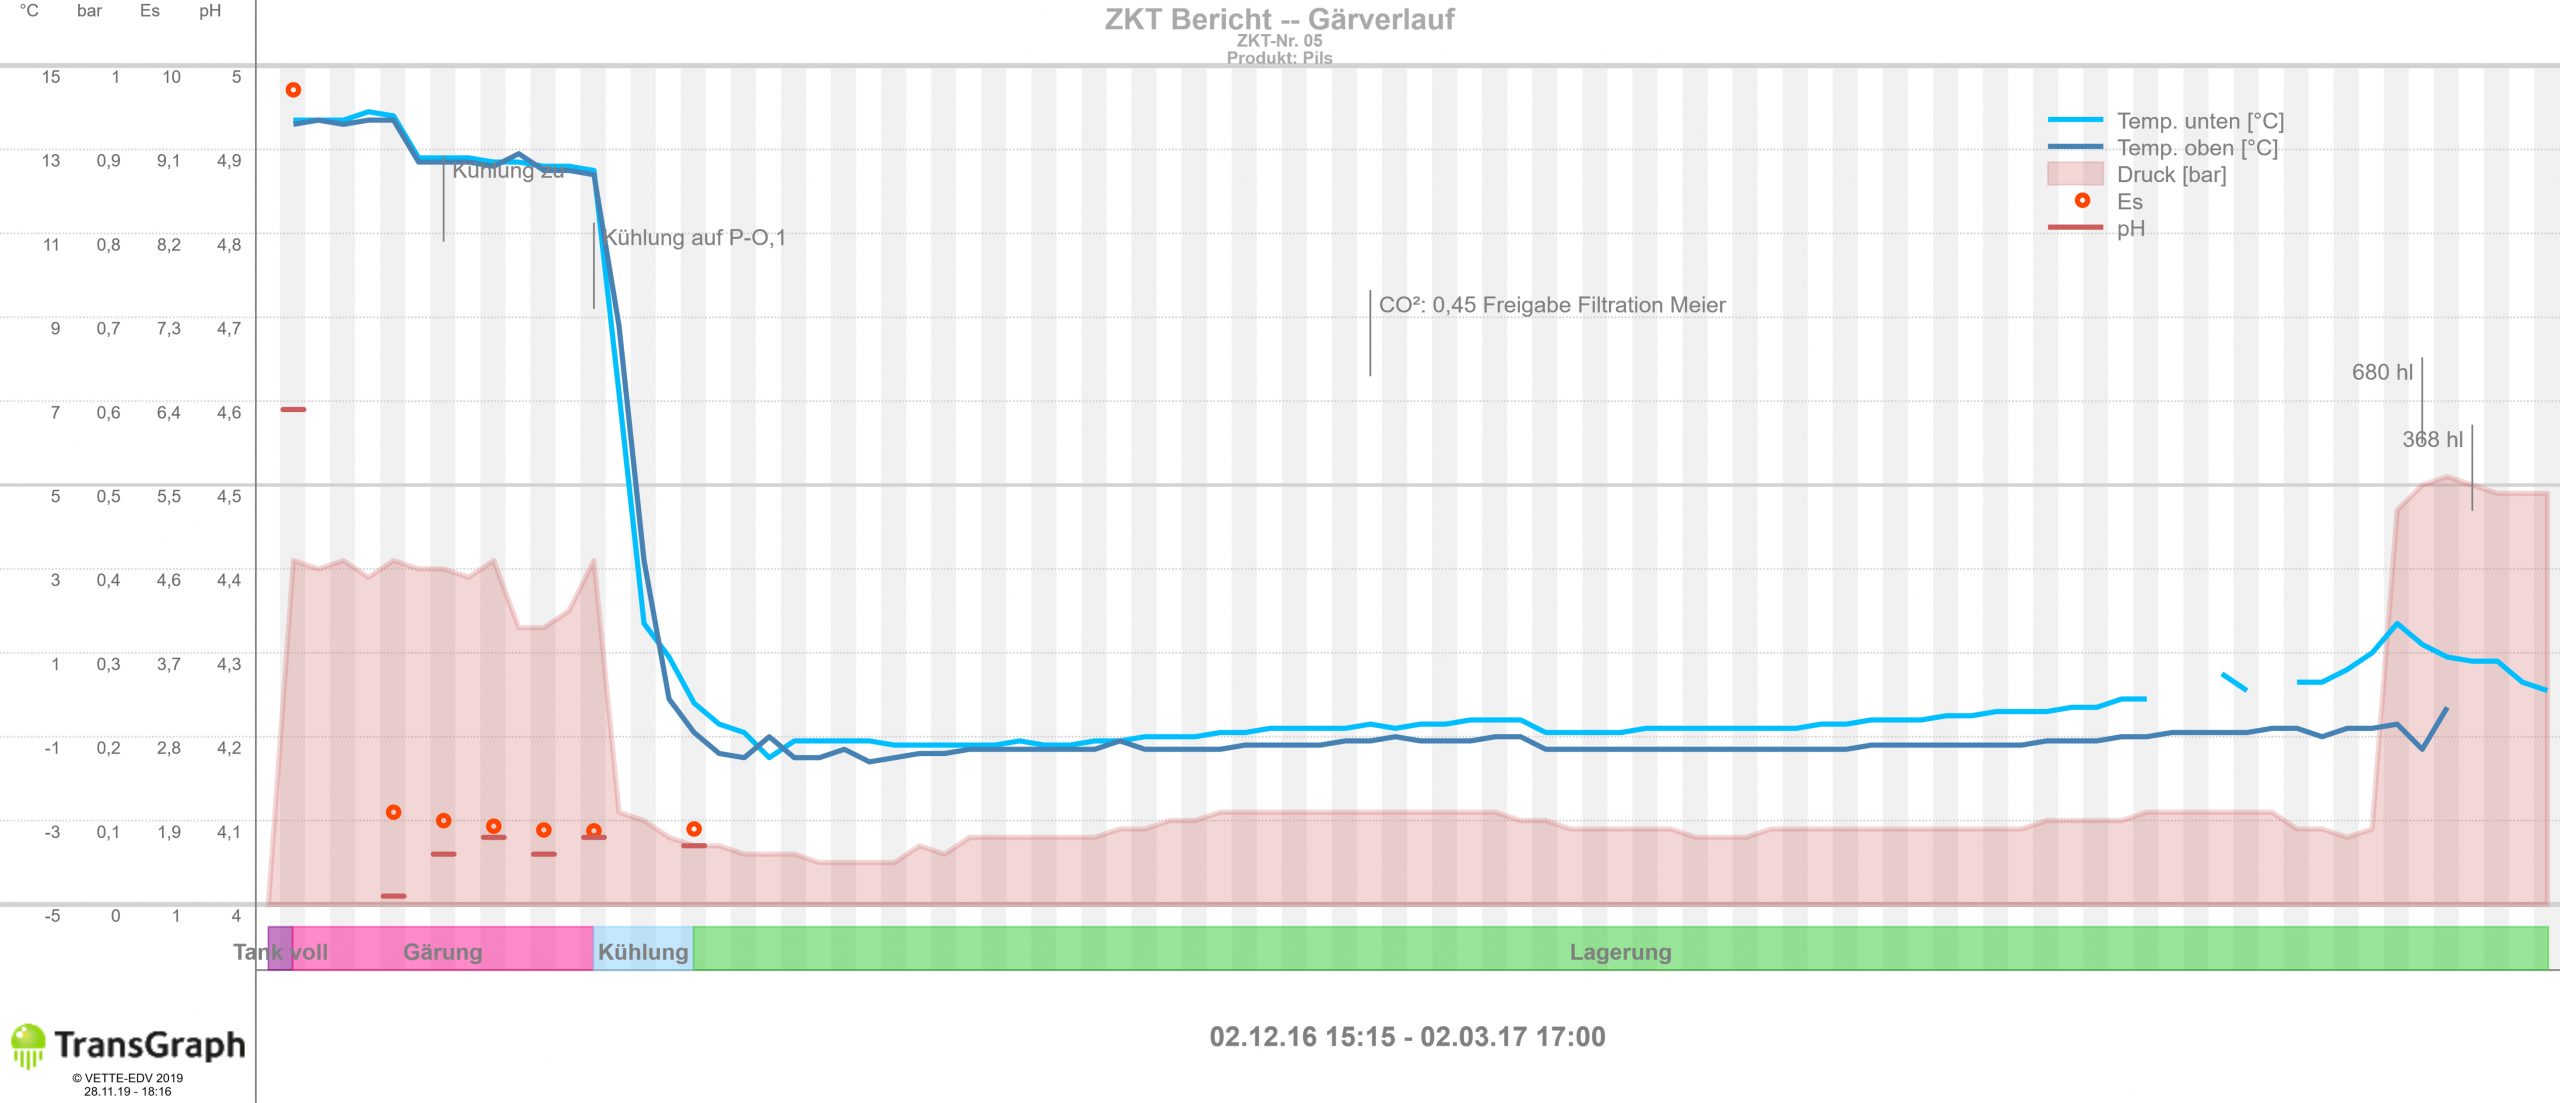
These functions help you to record and evaluate the quality parameters of production. Additional you have an overview of your inventories as well as the entire sampling of a production area.
Step by Step
3 steps to a successful launch
The Basics:
-
Lay out the master data. These include:
- Production fields: quantities, times, tanks... and link them to a production step
- Production tables: here the linking of individual steps to a data table takes place
- Recipes: deposit the recipes in a variety-specific and production-dependent manner
Afterwards:
- Link the data tables to the laboratory measuring points to be sampled.
Finally:
- Define the accountsfor controlling your inventories of all tanks, as well as the raw materials, operating materials and auxiliaries.
Are you a technical controller and want to evaluate the production data individually?
Then you are just right here!
The production data can be processed individually and evaluated directly via Excel or in a BI (business intelligence) system.
Do you want to receive all the data of a production process?
This is the destination of the production administration!
For us, completeness means that the production process includes all operating and quality data including laboratory samples, external documents (e.g. declaration of conformity) as well as upstream and downstream production processes.
You want to carry out production or batch planning and need your inventories of raw materials, auxiliary materials and operating materials?
This is our materials management including tank management!
Due to the integrated materials management, you can individually map the accounts of the raw materials, auxiliaries and operating materials as well as the tank inventories of your company in the system. Due to a minimum inventory check, the inventory track isn’t lost.