COMPANY DATA MANAGEMENT
TransGraph > Moduls > Company

Transparent control over all processes.
How does TransGraph improve company data management?
- Multiple location determination of measurements and intervals
- The backup of the measurements at intervals enables efficient working
- Constant transparency of all process data
- Complete flexibility by defining measuring and cost centers as well as recording measured values
- Manual or automatic data entry
- High security by message and alarm management
- Simple creation of daily, monthly and annual reports
These functions help you with the automatic acquisition of the PLC data. By linking to production, you can evaluate the data together with the production data.
Step by Step
3 steps to a successful launch
The Basics:
-
Lay out the master data. These include:
- Interfaces to control: define the data points that are available in the control
- Interval: set the read interval of the data points
- Cost centers: define the individual cost centers and link them to the data points.
Afterwards:
- Link the data points to the production reports and start the data scanner, which cyclically reads the data from the control.
Finally:
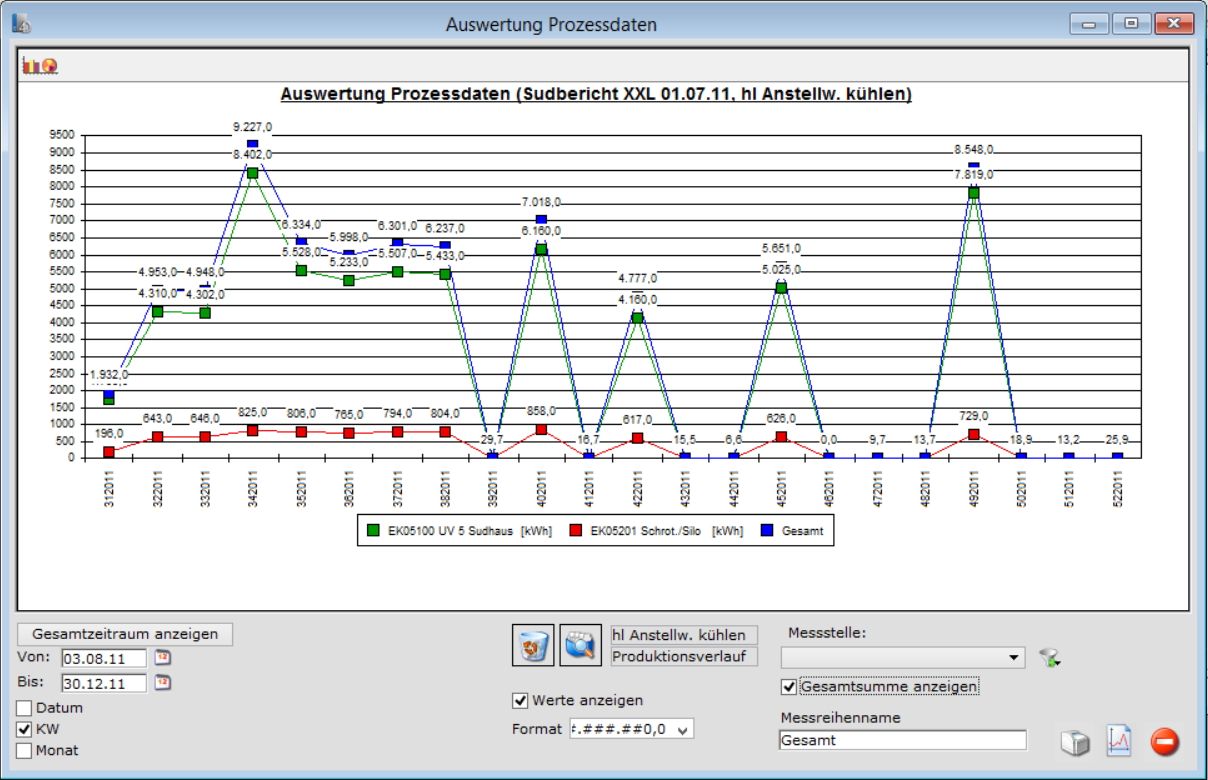
- Evaluate the imported data as a daily, monthly or annual report.
Are you a technical controller and want to evaluate the company data individually?
Then you are just right here!
The company data can be individually processed with the production data without much effort.
Do you want to receive all the data of a production process?
That is the goal of company data management!
Set the company data in relation to your production data.